
Read Me
Portfolio Vision is an advanced financial analytics platform designed to simplify the understanding of portfolio risk and expected returns for investments primarily focused on listed securities across European markets. Unlike traditional trading and portfolio analysis tools that rely heavily on historical performance data, Portfolio Vision is built on the principle that past performance is not indicative of future results, as consistently highlighted in financial product disclosure documents. Historical data within the platform serves exclusively as a reference tool, allowing users to visualize the historical evolution of a portfolio or create time-series records through periodic portfolio snapshots. However, historical performance does not influence the platform's forward-looking assessment of risk or expected returns. In addition, Portfolio Vision provides a comprehensive and interactive dashboard that enables users to monitor the evolution of financial markets while gaining insights into macroeconomic and geopolitical risks. The platform further enhances decision-making through AI-driven analysis and commentary generated by specialized AI agents, delivering structured market views and investment perspectives in a clear and accessible format.

Learn how to use PortfolioVision's features
Important: Always Monitor Loading Status
Check the status indicator in the page header. Wait for all data to be properly loaded (status shows "Ready") before using features or making decisions based on the displayed information.
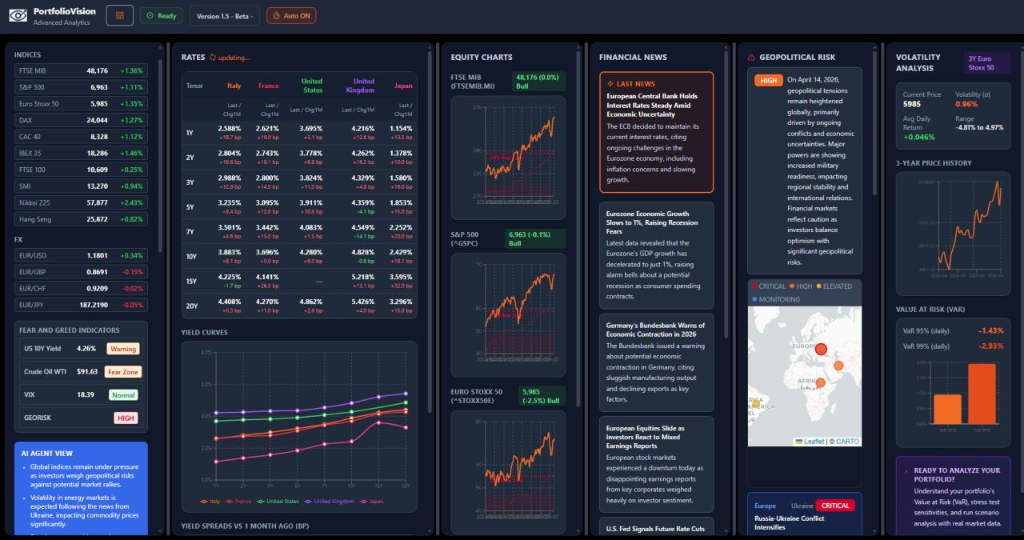
The Welcome page provides a real-time dashboard with six main sections:
- Market Indices: Live prices and daily changes for major global indices (FTSE MIB, S&P 500, Euro Stoxx 50, DAX, CAC 40, Nikkei 225, Hang Seng, etc.) and FX rates (EUR/USD, EUR/GBP, EUR/CHF, EUR/JPY)
- Fear and Greed Indicators: Key sentiment gauges including US 10Y Yield, Crude Oil WTI, VIX, and GEORISK — each color-coded to signal market conditions (Warning, Fear Zone, Normal, High)
- Rates Curves: Government bond yield curves for Italy, France, United States, United Kingdom, and Japan, with current rates by tenor (1Y to 20Y) and change vs 1 month ago in basis points
- Equity Charts: Price charts for major indices (FTSE MIB, S&P 500, Euro Stoxx 50) with trend indicators and AI-generated market status (Bull/Bear)
- Financial News: AI-generated summaries of the latest market headlines, earnings surprises, macro data releases, and geopolitical market movers — refreshed daily
- Geopolitical Risk: Global risk overview with an interactive map of hotspots, overall risk level (Critical / High / Elevated / Monitoring), regional descriptions, and financial impact analysis
- Volatility Analysis: 3-year price history and volatility metrics for the Euro Stoxx 50, including current price, average daily return, volatility range, and Value at Risk (VaR) at 95% and 99% confidence levels
Note: Market data may not be real-time. Always verify critical information from official sources.
Warning: Some sections on this page (Financial News, Geopolitical Risk, AI Agent View) rely on AI-powered data fetching. If the AI agent is unavailable or experiencing issues, these sections may not load or may display outdated content. All other market data sections will continue to function normally.
Your central hub for portfolio management with comprehensive overview and quick actions:
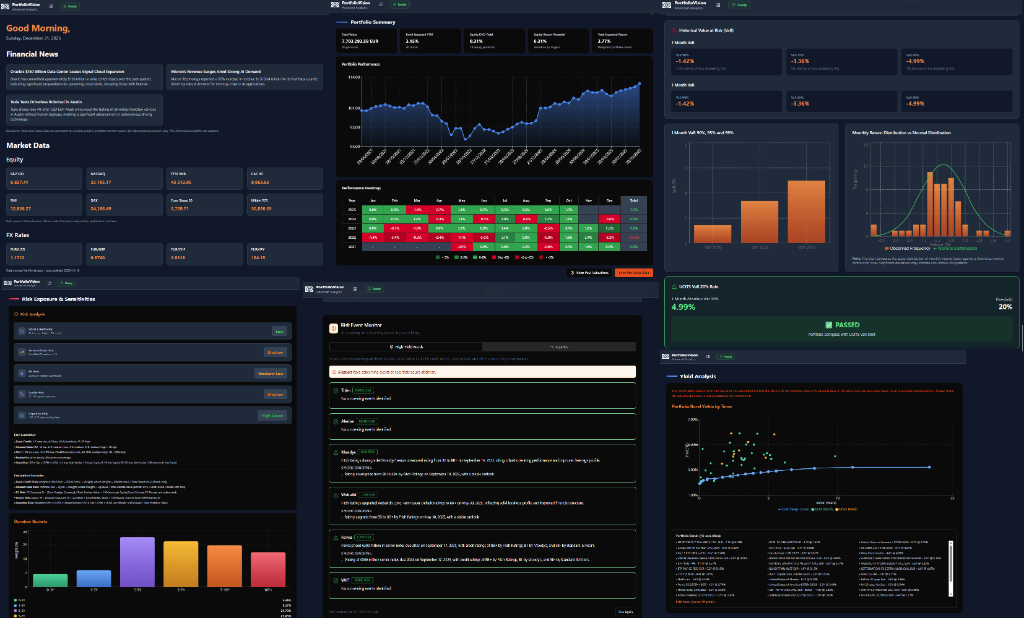
- Portfolio Overview: View all your portfolios in card or table layout with quick switching toggle
- Total Value: Aggregate value across all portfolios in reference currency with real-time FX conversion
- Expected YTM: Weighted yield-to-maturity across all bond holdings in your portfolios
- Credit Risk Score: Overall risk assessment (1-20 scale, 1 = AAA/Low Risk, 20 = NR/High Risk)
- Portfolio Cards: Each card shows portfolio name, strategy, value, expected return, and risk score with color-coded indicators
- Quick Actions: Click portfolio card to view details, use "New Portfolio" button to create, or search/filter portfolios
- Access Control: View portfolios you own, have access to, or all portfolios if you're an admin
Click on any portfolio card to view detailed analytics, performance charts, risk analysis, and generate reports.
Comprehensive tools for managing your investment portfolios, organized in four tabs:
Tab 1 — Upload / Update Portfolio
- Upload portfolio holdings from a CSV or Excel file
- Automatic parsing and data validation
- System matches securities against the internal database by ISIN
- Update an existing portfolio or create a new one from the uploaded file
- Missing securities are flagged — go to Security Management to import them first
Tab 2 — Create Portfolio
- Create a new portfolio from scratch with name, description, currency, and strategy
- Set access controls (authorized users, read-only users)
- Define portfolio metadata before adding positions
Tab 3 — Portfolio Editor
- Select an existing portfolio and manually add, edit, or remove individual positions
- Search and select securities from the internal database by ISIN or name
- Edit quantities, prices, and other position-level data
- Useful for incremental updates without re-uploading the full portfolio
Tab 4 — Upload Historical Index
- Upload historical NAV or index values for a portfolio
- Enables performance charts, heatmaps, and trend analysis in Portfolio Overview
- Supports date-value CSV format for flexible data input
Build and test hypothetical portfolios:
- Step 1 - Allocation: Set total investment amount and define asset class allocation (bonds, equities, commodities, cash)
- Step 2 - Bond Selection: Apply filters (rating, country, sector, maturity) and select individual bonds from database
- Step 3 - Equity/Commodity Selection: Choose equities, ETFs, and commodities to complete your allocation
- Step 4 - Recap: Review complete portfolio composition, expected returns, and risk metrics
- Risk Visualization: Pentagon radar chart showing risk-return profile
Use this feature to test different investment strategies before committing capital.
Manage the security database that powers portfolio analytics. Four tabs are available to all users:
Tab 1 — Import Equity, ETF & Derivatives
- Single Import: Enter ticker (e.g., AAPL, MSFT) and ISIN to fetch live data from Yahoo Finance and Morningstar
- Bulk Import: Upload a CSV with multiple tickers for batch processing
- Data Fetched: Market price, dividend yield, P/E ratio, 1Y target price, ADV, sector, industry
- ETF Support: Fetches TER, AUM, currency exposure, and dividend data
- Futures Support: Includes future multiplier for fair value calculation (Price × Multiplier × Quantity)
Tab 2 — Import Bond
- Enter an ISIN or a Borsa Italiana URL to fetch bond data automatically
- Data Extracted: Market price, coupon, frequency, maturity, YTM, modified duration, accrued interest
- Bond Types: Fixed rate, inflation-linked, structured, and equity-linked bonds
- Configure inflation exposure % or equity exposure % for specialized bonds
- Annual coupon is calculated automatically from periodic rate × payment frequency
Tab 3 — Create New Security
- Manually create a security record with full control over all fields
- Security Types: Bond, Equity, ETF, ETC, Fund, Equity Future, Bond Future, FX Future, Private Security
- Bond Fields: Coupon, frequency, maturity, YTM, price, accrued interest, duration, rating, seniority
- Equity/ETF Fields: Market price, dividend yield, P/E ratio, target price, market cap, ADV, TER, AUM
- Useful for private instruments or securities not available in any public data source
Tab 4 — Securities Update
- Search for an existing security by ISIN and manually edit its fields
- Update prices, YTM, ratings, risk scores, and other metadata individually
- Useful for manual corrections when automated import returns incorrect data
Powerful search and filtering tools to find securities in the database:
- Bond Search: Filter bonds by issuer, YTM range, maturity range, minimum lot size, country, rating, and seniority
- Bond Visualization: Interactive scatter chart showing tenor vs YTM with drill-down by issuer
- Equity Search: Search equities by ticker, sector, country, or ISIN with comprehensive details
- Future Search: Find futures and derivatives with contract specifications and expiry dates
- Results Table: View detailed information for matching securities with sorting and filtering
- Quick Export: Export search results for further analysis
Use this to discover investment opportunities and analyze market conditions across asset classes.
Compare multiple portfolios side-by-side to evaluate performance and risk profiles:
- Multi-Portfolio Selection: Select up to 4 portfolios for simultaneous comparison
- Key Metrics Dashboard: Compare total value, expected YTM, modified duration, and risk scores
- Risk Profile Charts: Side-by-side visualization of credit, interest rate, FX, and equity risks
- Asset Allocation: Compare allocation strategies across different asset classes
- Performance Metrics: Evaluate risk-adjusted returns and diversification benefits
- Visual Analytics: Interactive charts for easy comparison of portfolio characteristics
Use this to evaluate different investment strategies and optimize portfolio allocation decisions.
AI-powered portfolio analysis and professional commentary generation:
- Portfolio Selection: Choose any portfolio to analyze
- Key Metrics Display: View total value, expected YTM, modified duration, and risk levels
- Spread Analysis: Compares portfolio yield vs EUR swap curve and EUR corporate bond curve
- Negative Spread Warning: Alerts when portfolio yields less than comparable corporate bonds, suggesting better market alternatives
- AI Commentary: Generates professional investment commentary highlighting strengths and concerns
- Risk Assessment: Analyzes credit, FX, equity, and interest rate risks with professional insights
Generate professional commentary for client reporting and investment analysis. Always verify data independently.
Simulate market movements and stress-test portfolio performance:
- Interest Rate Scenarios: Simulate -5% to +5% shifts in interest rates
- Credit Spread Movements: Model credit rate changes from -5% to +5% with credit score-dependent impact
- Equity Market Scenarios: Test equity market movements from -100% to +100%
- FX Scenarios: Simulate currency movements from -30% to +30%
- P&L Calculation: Automatic profit/loss calculation based on portfolio sensitivities
- Impact Breakdown: Visualize individual and combined impacts with bar charts
- New Portfolio Value: Calculate projected portfolio value under stress scenarios
Important: Simulations are based on sensitivities calculated in Portfolio Detail. Non-linear payouts cannot be valued correctly. Flight to quality effects can influence results in portfolios with government bonds rated AA or higher.
Analyze and compare bond switching opportunities:
- Portfolio Selection: Select portfolio to analyze bond holdings
- Current Bond Selection: Choose bond from current portfolio holdings
- Alternative Selection: Search and select alternative bonds from database
- Comparative Analysis: Side-by-side comparison of YTM, duration, rating, price, and spreads
- Portfolio Impact: Calculate impact on overall portfolio metrics
- Visual Comparison: Charts showing key differences and trade-offs
Use this to evaluate bond replacement opportunities and optimize fixed income holdings.
Calculate Value at Risk (VaR) for portfolio risk management:
- Confidence Levels: Choose between 95%, 99%, or custom confidence levels
- Time Horizons: Calculate 1-day, 10-day, or custom period VaR
- Risk Components: Breakdown by interest rate risk, credit risk, equity risk, and FX risk
- Historical Simulation: Uses historical volatility and correlation data
- Parametric Method: Normal distribution assumption for simplified calculation
- VaR Decomposition: Understand contribution of each risk factor to total VaR
- Stress Testing: Combines with scenario analysis for comprehensive risk assessment
Essential for regulatory reporting and risk management. Understand maximum expected loss at given confidence level.
Evaluate portfolio liquidity under stress scenarios:
- Liquidity Scoring: Each security rated based on Average Daily Volume (ADV) and bid-offer spreads
- Liquidation Scenarios: Simulate forced liquidation scenarios with market impact
- Time-to-Liquidate: Calculate days required to liquidate positions without excessive market impact
- Liquidity Concentration: Identify concentration risk in illiquid securities
- Market Impact Costs: Estimate slippage and transaction costs under stress
- Redemption Scenarios: Test ability to meet investor redemptions without forced sales
- Risk Alerts: Highlight positions with high liquidity risk
Critical for fund managers and portfolio managers to ensure adequate liquidity buffers and avoid liquidity crises.
- Always wait for data to load completely before making decisions (check page header status indicator)
- Use the "Refresh" button on portfolio detail pages to update calculations with latest market data
- Save portfolio valuations regularly to track historical performance
- Export reports using the "Print Report" function for client presentations
- Keep your security database up-to-date for accurate analytics
- Use the Help button to report any issues or missing data